

Industrial supplier Fastenal (NASDAQ:FAST) met Wall Streets revenue expectations in Q4 CY2025, with sales up 11.1% year on year to $2.03 billion. Its GAAP profit of $0.26 per share was in line with analysts’ consensus estimates.
Is now the time to buy Fastenal? Find out by accessing our full research report, it’s free.
Fastenal (FAST) Q4 CY2025 Highlights:
- Revenue: $2.03 billion vs analyst estimates of $2.03 billion (11.1% year-on-year growth, in line)
- EPS (GAAP): $0.26 vs analyst estimates of $0.26 (in line)
- Adjusted EBITDA: $428.2 million vs analyst estimates of $441.2 million (21.1% margin, 2.9% miss)
- Operating Margin: 19%, in line with the same quarter last year
- Free Cash Flow Margin: 15.2%, up from 12.2% in the same quarter last year
- Sales Volumes rose 7.6% year on year (12.2% in the same quarter last year)
- Market Capitalization: $50.22 billion
Company Overview
Founded in 1967, Fastenal (NASDAQ:FAST) provides industrial and construction supplies, including fasteners, tools, safety products, and many other product categories to businesses globally.
Revenue Growth
A company’s long-term sales performance can indicate its overall quality. Any business can put up a good quarter or two, but many enduring ones grow for years. Over the last five years, Fastenal grew its sales at a decent 7.7% compounded annual growth rate. Its growth was slightly above the average industrials company and shows its offerings resonate with customers.
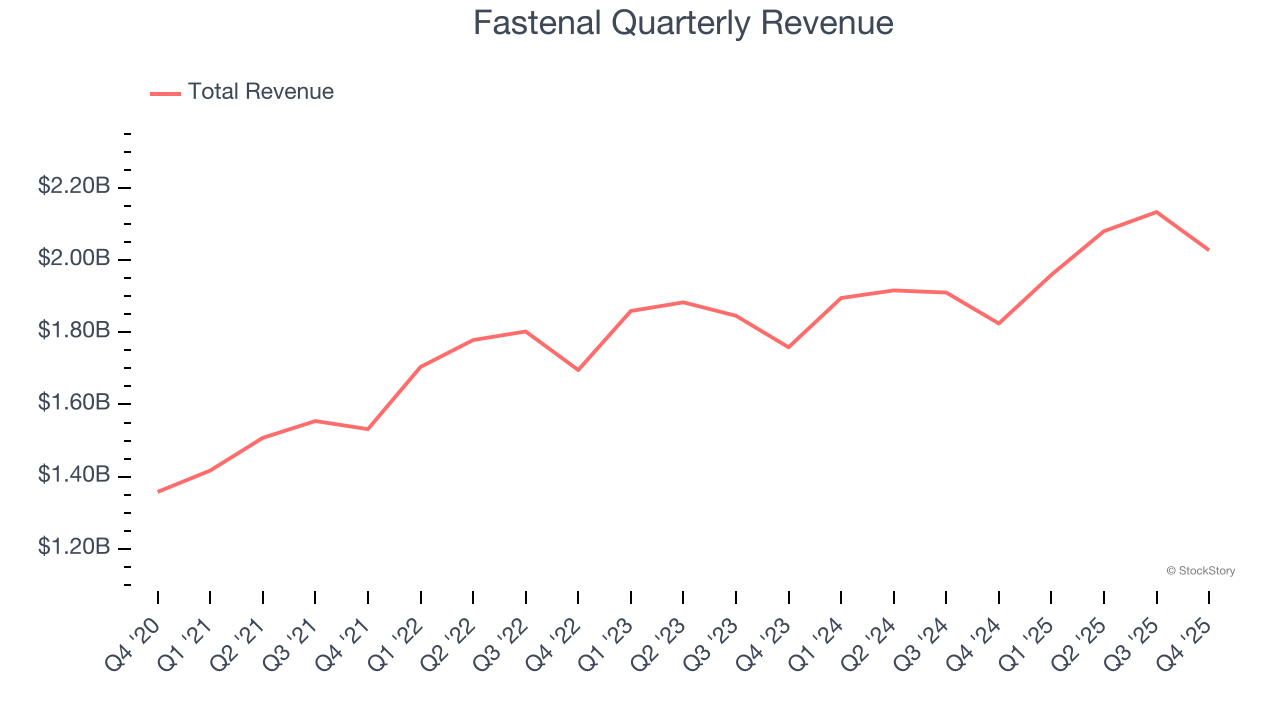
Long-term growth is the most important, but within industrials, a half-decade historical view may miss new industry trends or demand cycles. Fastenal’s recent performance shows its demand has slowed as its annualized revenue growth of 5.7% over the last two years was below its five-year trend. 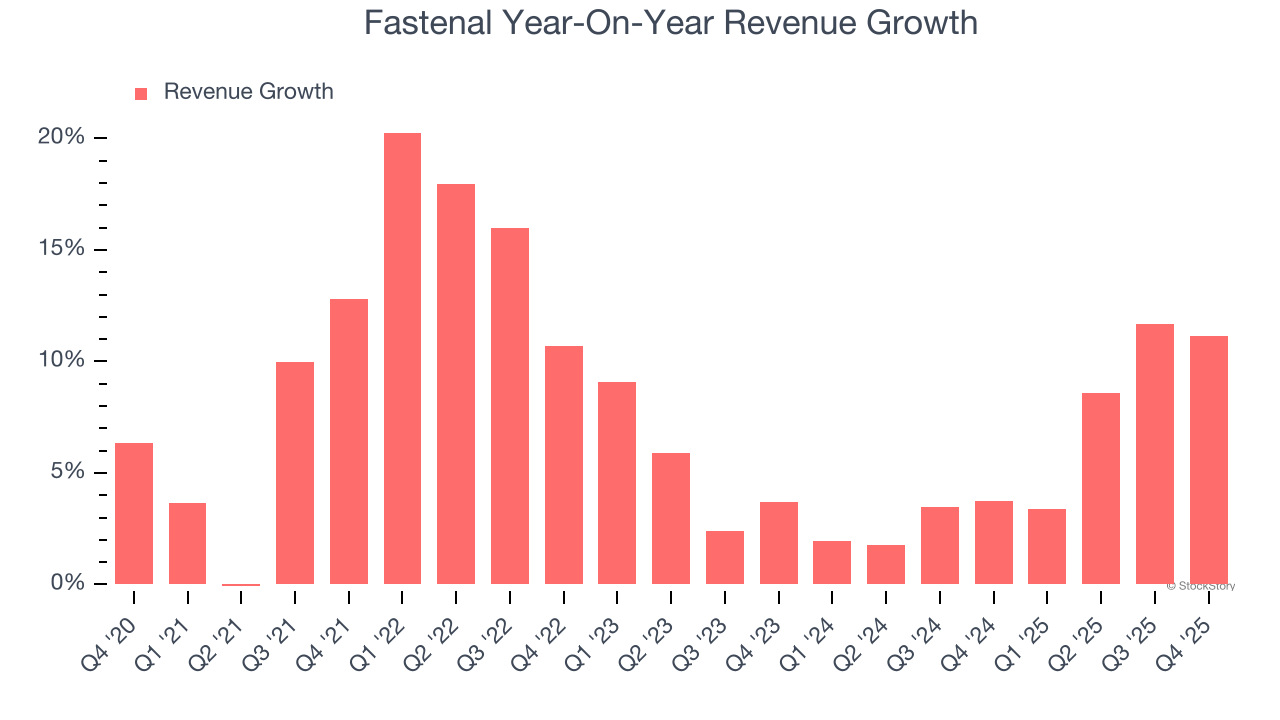
We can dig further into the company’s revenue dynamics by analyzing its number of units sold, which reached 136,638 in the latest quarter. Over the last two years, Fastenal’s units sold averaged 10.7% year-on-year growth. Because this number is better than its revenue growth, we can see the company’s average selling price decreased. 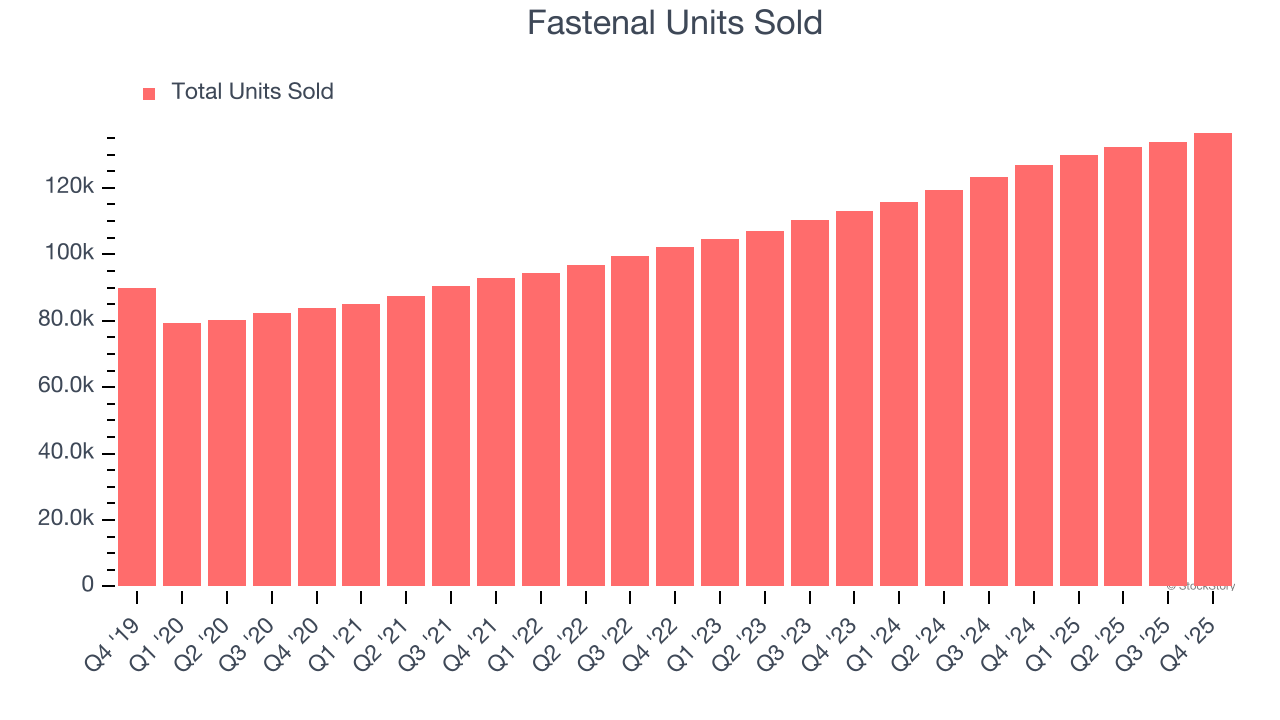
This quarter, Fastenal’s year-on-year revenue growth was 11.1%, and its $2.03 billion of revenue was in line with Wall Street’s estimates.
Looking ahead, sell-side analysts expect revenue to grow 9.2% over the next 12 months, an improvement versus the last two years. This projection is healthy and implies its newer products and services will catalyze better top-line performance.
Software is eating the world and there is virtually no industry left that has been untouched by it. That drives increasing demand for tools helping software developers do their jobs, whether it be monitoring critical cloud infrastructure, integrating audio and video functionality, or ensuring smooth content streaming. Click here to access a free report on our 3 favorite stocks to play this generational megatrend.
Operating Margin
Fastenal’s operating margin might fluctuated slightly over the last 12 months but has remained more or less the same, averaging 20.4% over the last five years. This profitability was elite for an industrials business thanks to its efficient cost structure and economies of scale. This result isn’t surprising as its high gross margin gives it a favorable starting point.
Looking at the trend in its profitability, Fastenal’s operating margin might fluctuated slightly but has generally stayed the same over the last five years. This raises questions about the company’s expense base because its revenue growth should have given it leverage on its fixed costs, resulting in better economies of scale and profitability.
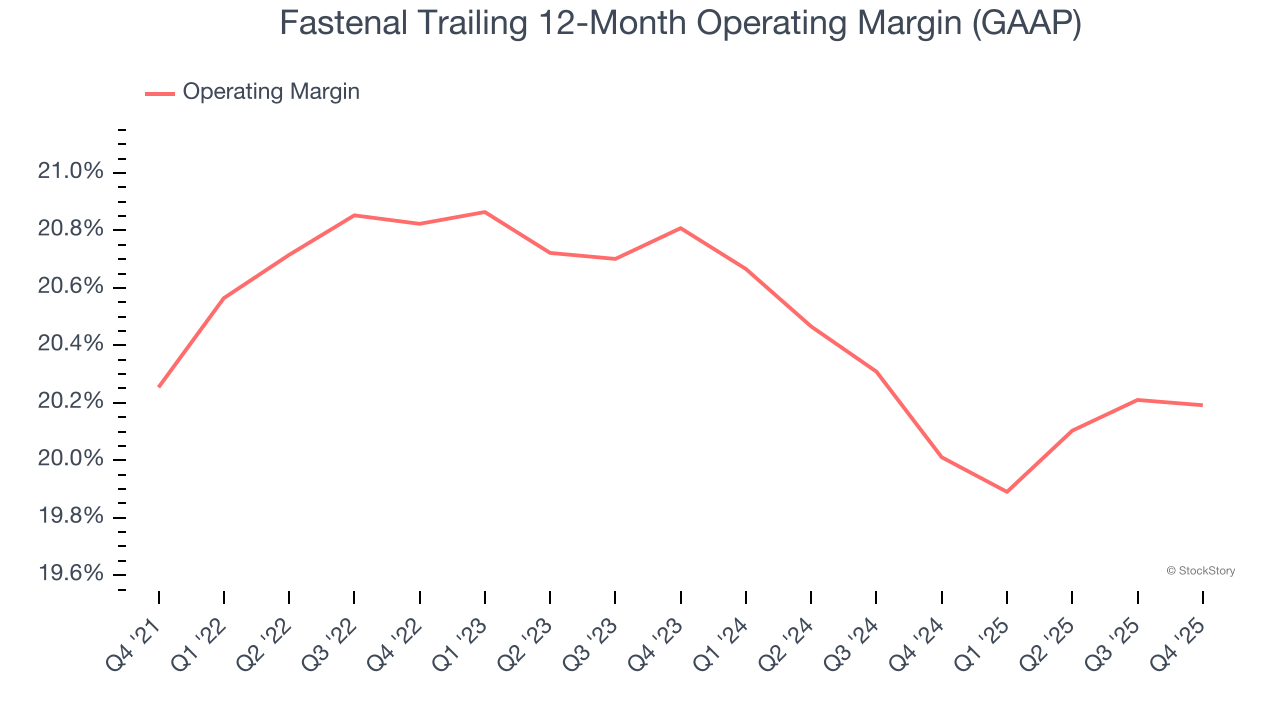
In Q4, Fastenal generated an operating margin profit margin of 19%, in line with the same quarter last year. This indicates the company’s cost structure has recently been stable.
Earnings Per Share
Revenue trends explain a company’s historical growth, but the long-term change in earnings per share (EPS) points to the profitability of that growth – for example, a company could inflate its sales through excessive spending on advertising and promotions.
Fastenal’s decent 8% annual EPS growth over the last five years aligns with its revenue performance. This tells us it maintained its per-share profitability as it expanded.
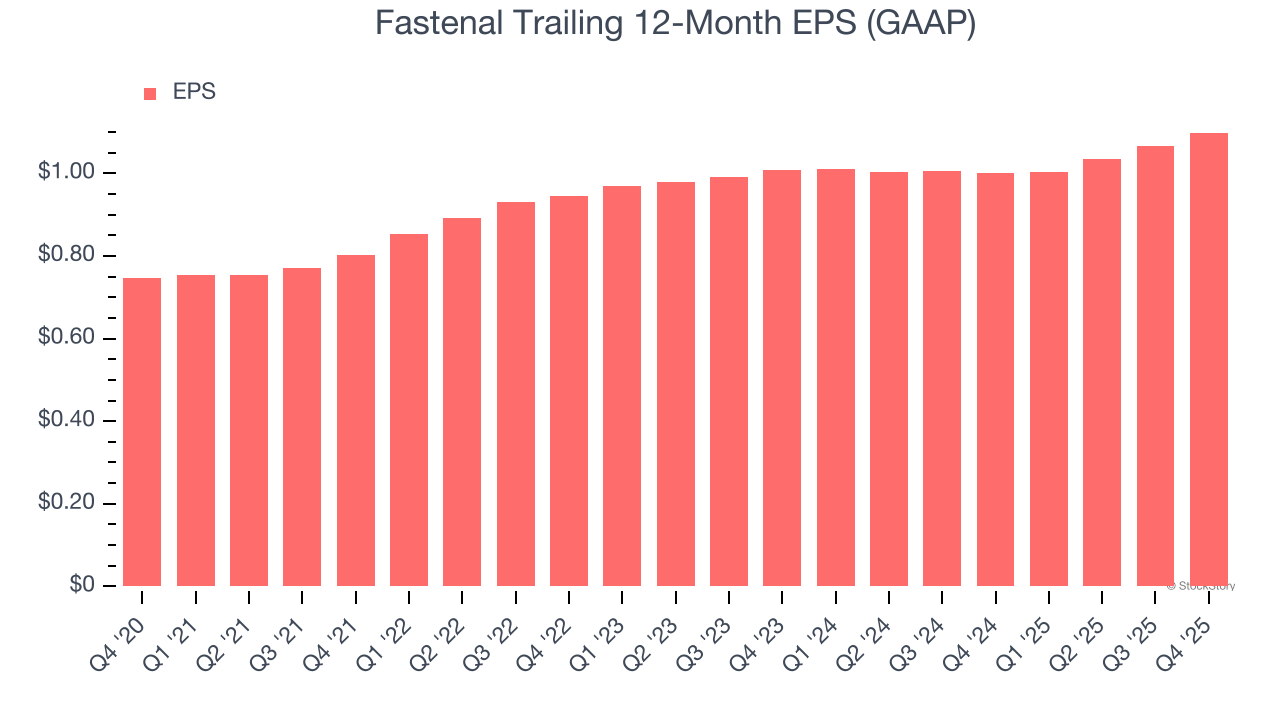
Like with revenue, we analyze EPS over a shorter period to see if we are missing a change in the business.
For Fastenal, its two-year annual EPS growth of 4.4% was lower than its five-year trend. We hope its growth can accelerate in the future.
In Q4, Fastenal reported EPS of $0.26, up from $0.23 in the same quarter last year. This print was close to analysts’ estimates. Over the next 12 months, Wall Street expects Fastenal’s full-year EPS of $1.10 to grow 10.6%.
Key Takeaways from Fastenal’s Q4 Results
We struggled to find many positives in these results. Its EBITDA missed and its revenue was in line with Wall Street’s estimates. Overall, this quarter could have been better. The stock traded down 4.6% to $41.75 immediately after reporting.
Fastenal didn’t show it’s best hand this quarter, but does that create an opportunity to buy the stock right now? We think that the latest quarter is only one piece of the longer-term business quality puzzle. Quality, when combined with valuation, can help determine if the stock is a buy. We cover that in our actionable full research report which you can read here (it’s free).