

Vertically integrated manufacturing solutions provider Mayville Engineering Company (NYSE:MEC) beat Wall Street’s revenue expectations in Q1 CY2026, with sales up 6.8% year on year to $144.8 million. On top of that, next quarter’s revenue guidance ($150 million at the midpoint) was surprisingly good and 4.8% above what analysts were expecting. Its non-GAAP loss of $0.15 per share was 30.8% above analysts’ consensus estimates.
Is now the time to buy Mayville Engineering? Find out by accessing our full research report, it’s free.
Mayville Engineering (MEC) Q1 CY2026 Highlights:
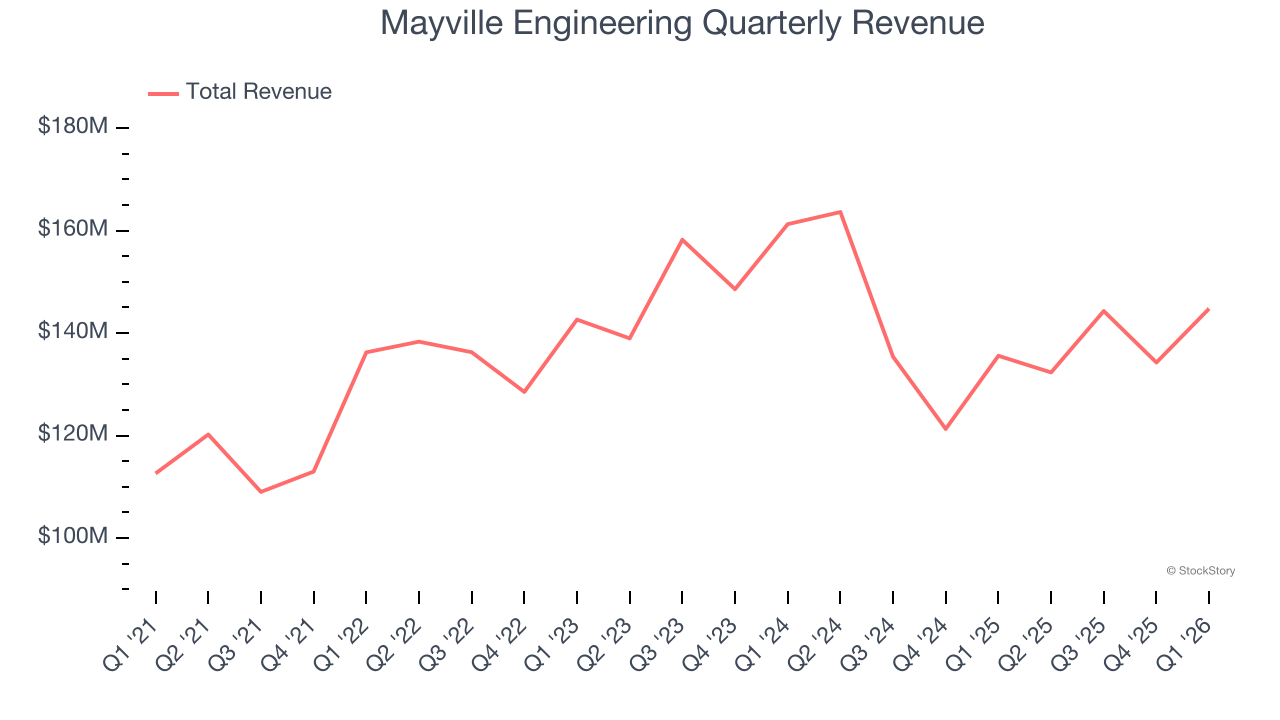
- Revenue: $144.8 million vs analyst estimates of $139.6 million (6.8% year-on-year growth, 3.7% beat)
- Adjusted EPS: -$0.15 vs analyst estimates of -$0.22 (30.8% beat)
- Adjusted EBITDA: $6.47 million vs analyst estimates of $6.01 million (4.5% margin, 7.8% beat)
- The company slightly lifted its revenue guidance for the full year to $605 million at the midpoint from $600 million
- EBITDA guidance for the full year is $56 million at the midpoint, above analyst estimates of $53.6 million
- Operating Margin: -5.3%, down from 1.2% in the same quarter last year
- Free Cash Flow was -$6.94 million, down from $5.37 million in the same quarter last year
- Market Capitalization: $450.1 million
Company Overview
Originally founded solely on tool and die manufacturing, Mayville Engineering Company (NYSE:MEC) specializes in metal fabrication, tube bending, and welding to be used in various industries.
Revenue Growth
Reviewing a company’s long-term sales performance reveals insights into its quality. Any business can have short-term success, but a top-tier one grows for years. Over the last five years, Mayville Engineering grew its sales at a decent 9% compounded annual growth rate. Its growth was slightly above the average industrials company and shows its offerings resonate with customers.
Long-term growth is the most important, but within industrials, a half-decade historical view may miss new industry trends or demand cycles. Mayville Engineering’s recent performance marks a sharp pivot from its five-year trend as its revenue has shown annualized declines of 4.3% over the last two years. 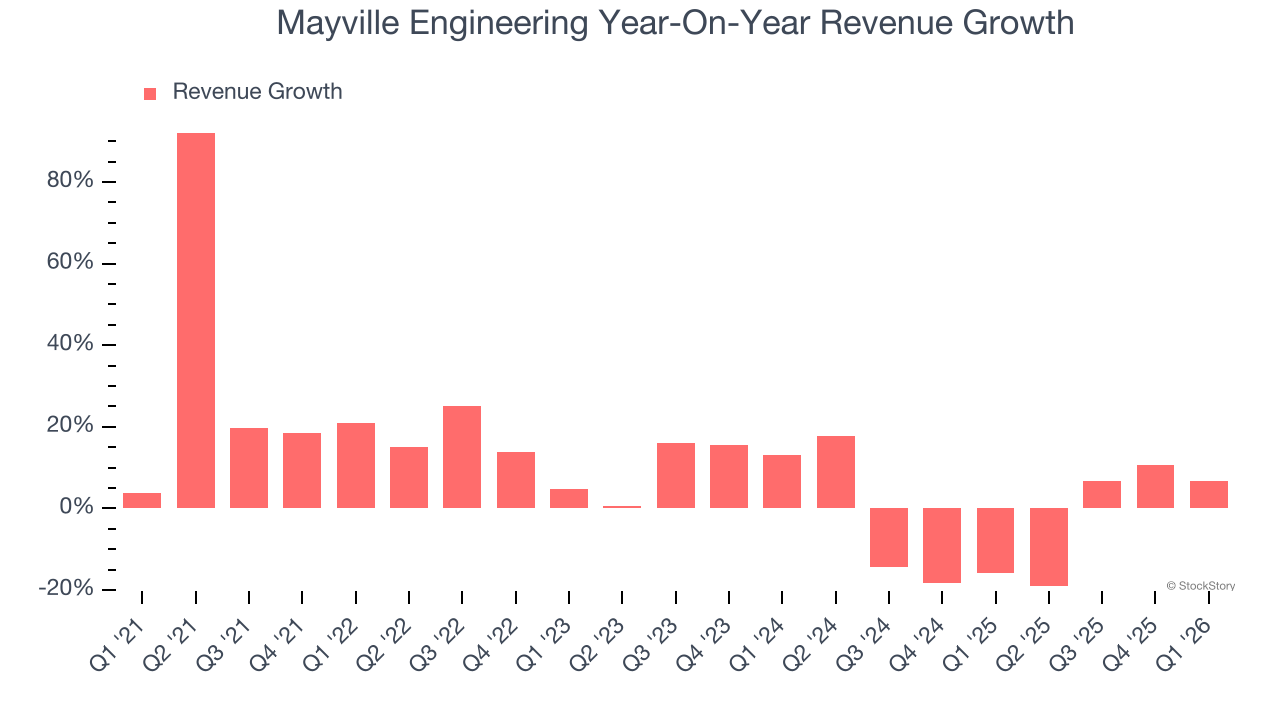
Mayville Engineering also breaks out the revenue for its most important segments, Commercial Vehicle and Construction & Access, which are 26.8% and 13.9% of revenue. Over the last two years, Mayville Engineering’s Commercial Vehicle revenue (exhaust, engine components, fuel systems) averaged 18.6% year-on-year declines while its Construction & Access revenue (fenders, hoods, frames for heavy machinery) averaged 10.9% declines. 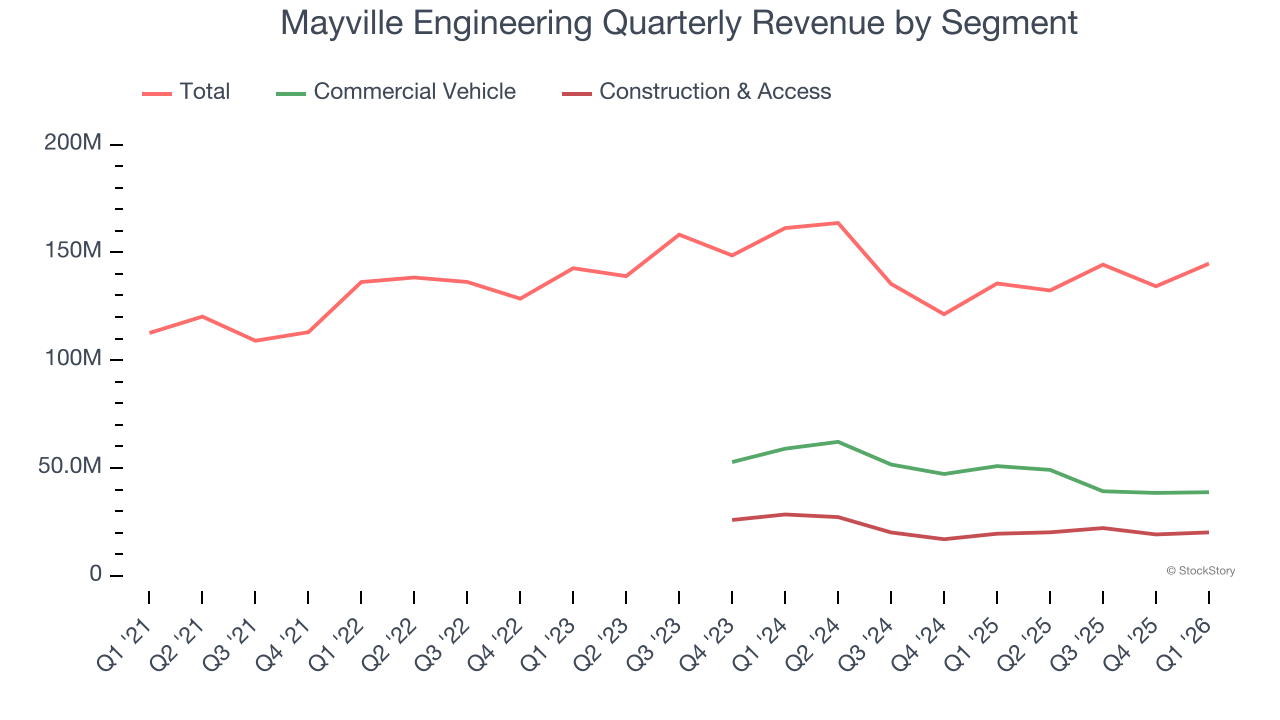
This quarter, Mayville Engineering reported year-on-year revenue growth of 6.8%, and its $144.8 million of revenue exceeded Wall Street’s estimates by 3.7%. Company management is currently guiding for a 13.4% year-on-year increase in sales next quarter.
Looking further ahead, sell-side analysts expect revenue to grow 10.6% over the next 12 months, an improvement versus the last two years. This projection is commendable and implies its newer products and services will spur better top-line performance.
ONE MORE THING: 3 Hidden Platforms Growing 3X Faster than Amazon, Google, and PayPal. Amazon, Google, and Meta all followed the same playbook: Dominate an ignored market. Build an unbeatable moat. Scale until you’re unstoppable.
These three platforms are running that exact playbook right now. The early investors in Amazon made fortunes. The early investors in these could do the same. Get All 3 Stocks Here for FREE.
Operating Margin
Operating margin is one of the best measures of profitability because it tells us how much money a company takes home after procuring and manufacturing its products, marketing and selling those products, and most importantly, keeping them relevant through research and development.
Mayville Engineering was profitable over the last five years but held back by its large cost base. Its average operating margin of 2.5% was weak for an industrials business. This result isn’t too surprising given its low gross margin as a starting point.
Looking at the trend in its profitability, Mayville Engineering’s operating margin decreased by 1.1 percentage points over the last five years. This raises questions about the company’s expense base because its revenue growth should have given it leverage on its fixed costs, resulting in better economies of scale and profitability. Mayville Engineering’s performance was poor no matter how you look at it - it shows that costs were rising and it couldn’t pass them onto its customers.
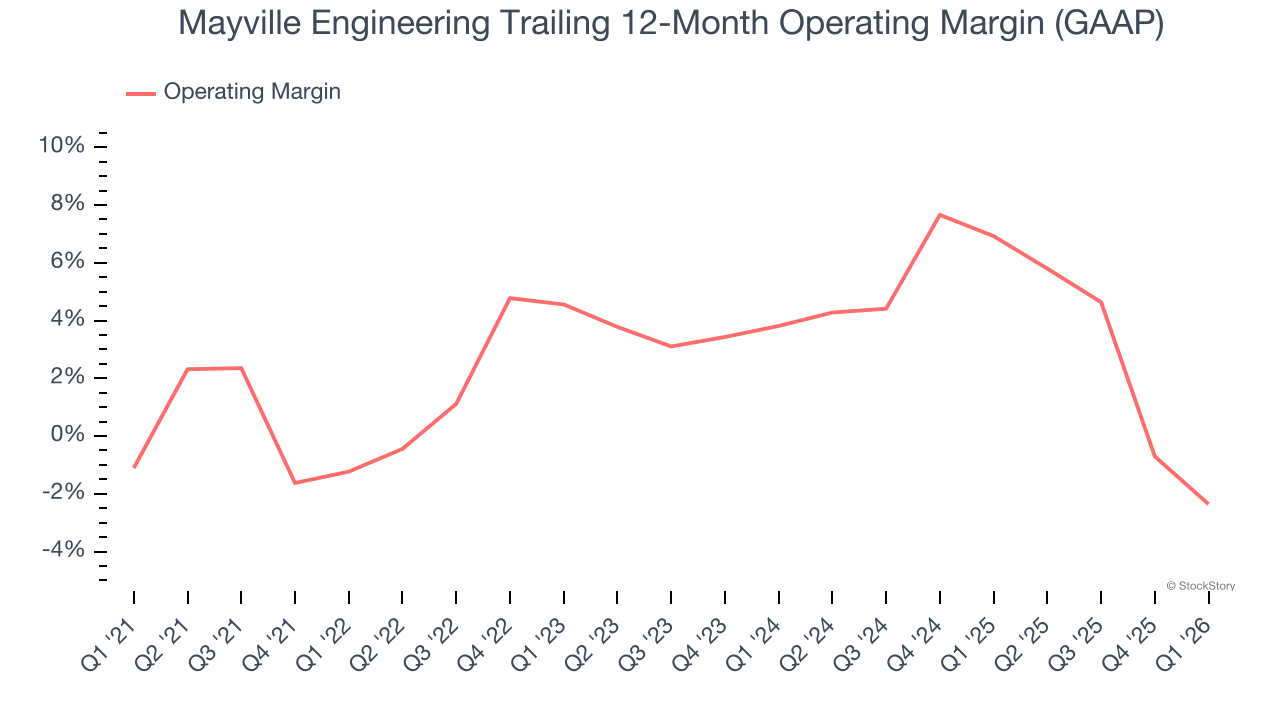
This quarter, Mayville Engineering generated an operating margin profit margin of negative 5.3%, down 6.5 percentage points year on year. Since Mayville Engineering’s operating margin decreased more than its gross margin, we can assume it was less efficient because expenses such as marketing, R&D, and administrative overhead increased.
Earnings Per Share
Revenue trends explain a company’s historical growth, but the long-term change in earnings per share (EPS) points to the profitability of that growth – for example, a company could inflate its sales through excessive spending on advertising and promotions.
Although Mayville Engineering’s full-year earnings are still negative, it reduced its losses and improved its EPS by 26% annually over the last five years. The next few quarters will be critical for assessing its long-term profitability.
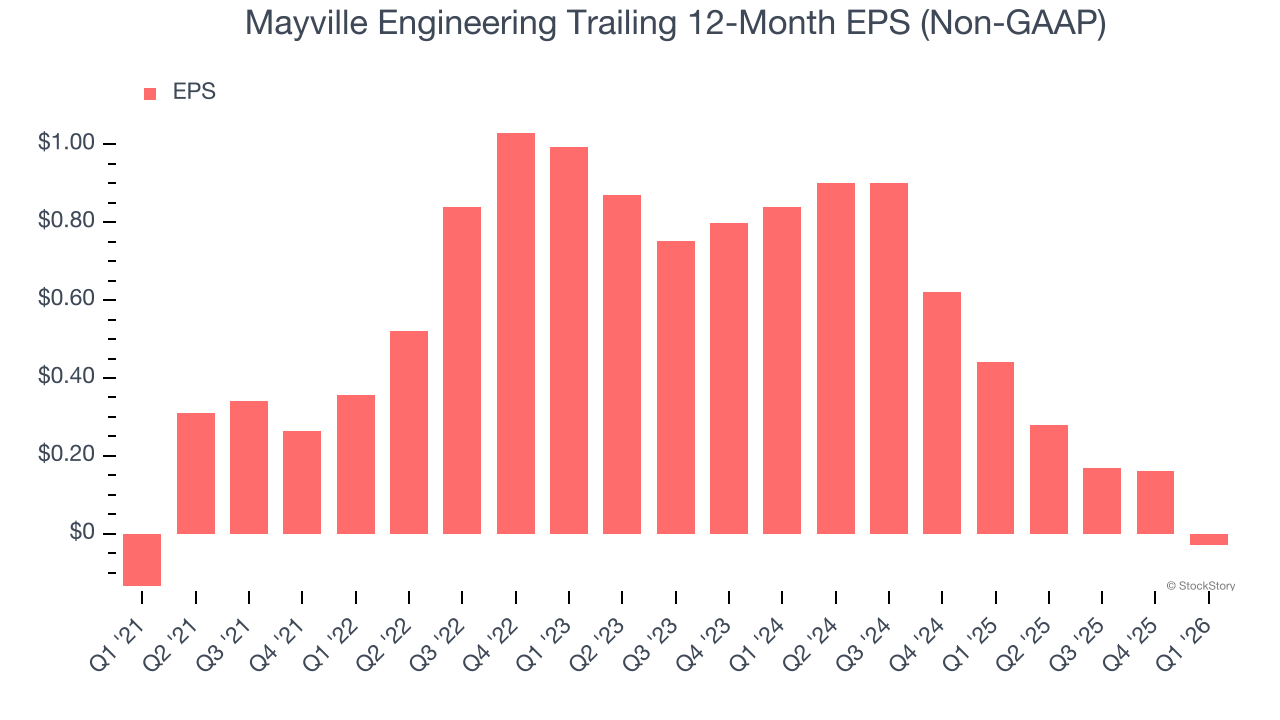
Like with revenue, we analyze EPS over a more recent period because it can provide insight into an emerging theme or development for the business.
Sadly for Mayville Engineering, its EPS declined by more than its revenue over the last two years, dropping 42.7%. This tells us the company struggled to adjust to shrinking demand.
Diving into the nuances of Mayville Engineering’s earnings can give us a better understanding of its performance. Mayville Engineering’s operating margin has declined over the last two years. This was the most relevant factor (aside from the revenue impact) behind its lower earnings; interest expenses and taxes can also affect EPS but don’t tell us as much about a company’s fundamentals.
In Q1, Mayville Engineering reported adjusted EPS of negative $0.15, down from $0.04 in the same quarter last year. Despite falling year on year, this print easily cleared analysts’ estimates. Over the next 12 months, Wall Street is optimistic. Analysts forecast Mayville Engineering’s full-year EPS of negative $0.03 will flip to positive $0.65.
Key Takeaways from Mayville Engineering’s Q1 Results
It was good to see Mayville Engineering beat analysts’ EPS expectations this quarter. We were also excited its EBITDA outperformed Wall Street’s estimates by a wide margin. On the other hand, its adjusted operating income missed. Zooming out, we think this was a solid print. The market seemed to be hoping for more, and the stock traded down 3.1% to $22 immediately after reporting.
Is Mayville Engineering an attractive investment opportunity right now? When making that decision, it’s important to consider its valuation, business qualities, as well as what has happened in the latest quarter. We cover that in our actionable full research report which you can read here (it’s free).