

Offshore drilling contractor Transocean (NYSE:RIG) reported Q2 CY2026 results exceeding the market’s revenue expectations, but sales fell by 2.2% year on year to $966 million. Its non-GAAP profit of $0.03 per share was $0.02 above analysts’ consensus estimates.
Is now the time to buy Transocean? Find out by accessing our full research report, it’s free.
Transocean (RIG) Q2 CY2026 Highlights:
- Revenue: $966 million vs analyst estimates of $953.1 million (2.2% year-on-year decline, 1.4% beat)
- Adjusted EPS: $0.03 vs analyst estimates of $0.01 ($0.02 beat)
- Adjusted EBITDA: $312 million vs analyst estimates of $284.3 million (32.3% margin, 9.7% beat)
- Operating Margin: 15.7%, up from -97.6% in the same quarter last year
- Free Cash Flow Margin: 21.9%, up from 10.5% in the same quarter last year
- Market Capitalization: $5.74 billion
“Transocean delivered a strong second quarter, supported by 97% revenue efficiency and solid adjusted EBITDA margins, resulting in excellent cash flow and improved liquidity,” said Keelan Adamson, Transocean’s CEO.
Company Overview
Operating one of the world's most capable fleets of ultra-deepwater drillships and harsh environment rigs, Transocean (NYSE:RIG) operates drilling rigs that energy companies rent to drill oil and gas wells in deep ocean waters.
Revenue Growth
Cyclical sectors like Energy often flatter weaker operators during favorable price environments, but a longer-term lens separates those from businesses that can consistently perform across market cycles. Unfortunately, Transocean’s 6.5% annualized revenue growth over the last five years was sluggish. This fell short of our benchmark for the energy upstream and integrated energy sector and is a tough starting point for our analysis.
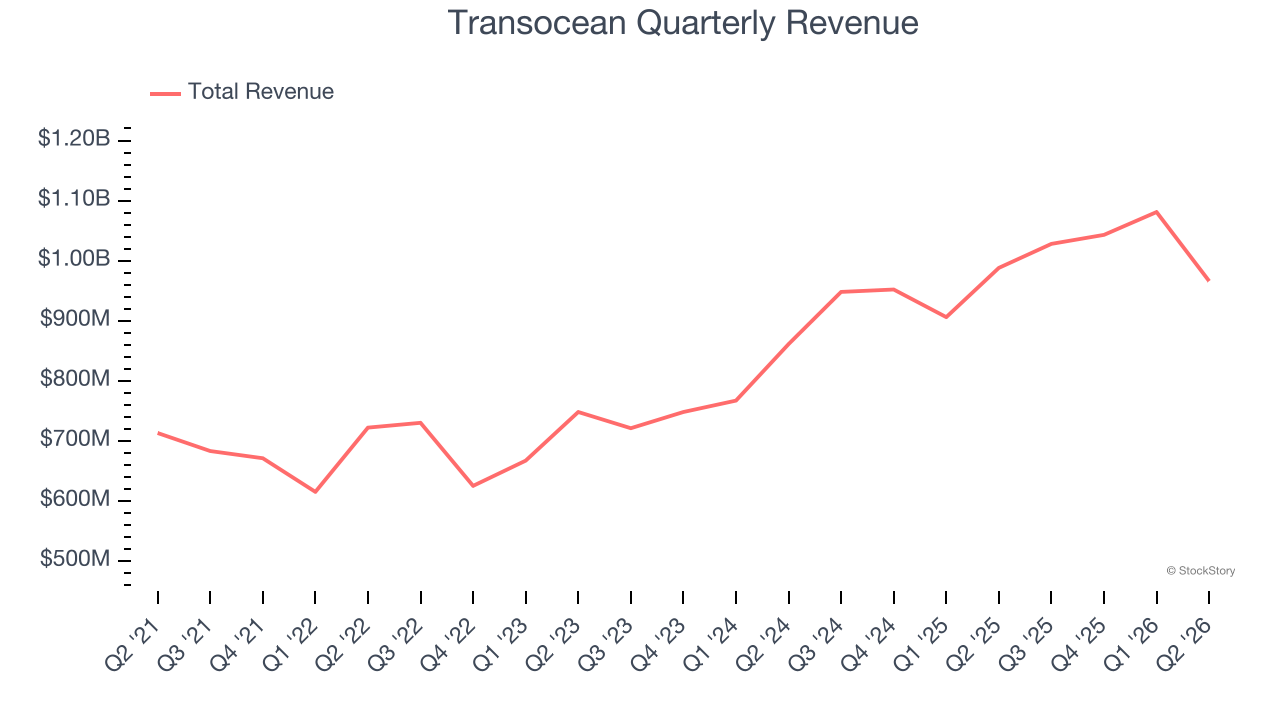
Even a long stretch in Energy can be shaped by a single commodity cycle, so extending the view to ten years adds another perspective and reveals which companies are built to grow regardless of the pricing regime. Transocean’s performance shows it grew in the past five-year but relinquished its gains over the last ten years, as its revenue fell by 3.3% annually.
This quarter, Transocean’s revenue fell by 2.2% year on year to $966 million but beat Wall Street’s estimates by 1.4%.
ONE MORE THING: The $21 AI Application Stock Wall Street Forgot. While Wall Street obsesses over who’s building AI, one company is already using it to print money. And nobody’s paying attention.
AI chip stocks trade at ridiculous valuations. This company processes a trillion consumer signals monthly using AI and trades at a third of the price. The gap won’t last. The institutions will figure it out. You need to see this first. Read the FREE Report Before They Notice.
Adjusted EBITDA Margin
Transocean was profitable over the last five years but held back by its large cost base. Its average EBITDA margin of 32.1% was weak for an upstream and integrated energy business.
On the plus side, Transocean’s EBITDA margin rose by 3.7 percentage points over the last year.
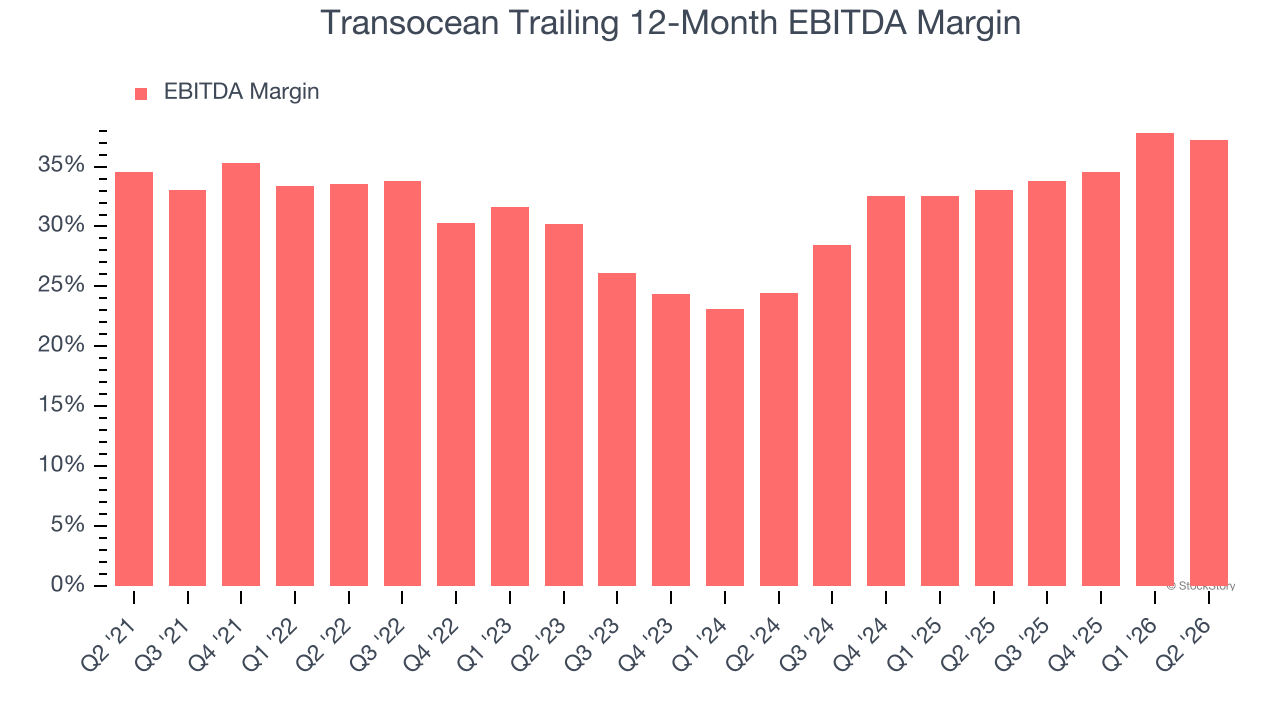
This quarter, Transocean generated an EBITDA margin profit margin of 32.3%, down 2.5 percentage points year on year. This contraction shows it was less efficient because its expenses increased relative to its revenue. This adjusted EBITDA beat Wall Street’s estimates by 7.5%.
Cash Is King
As mentioned above, adjusted EBITDA ignores capital structure and drilling expenditure decisions. These are two huge aspects of an Energy producer, so in order to understand a comprehensive picture of business quality, an investor needs to account for these. Said differently, adjusted EBITDA margins could be solid but free cash flow is abysmal because decline rates of the asset are extreme and the drilling is expensive. Free cash flow tells you about not only the economics of the production that has happened but how much it costs to stay in business as well (further drilling or extraction).
Transocean has shown mediocre cash profitability relative to peers over the last five years, giving the company fewer opportunities to return capital to shareholders. Its free cash flow margin averaged 5.2%, below what we’d expect for an upstream and integrated energy business.
The level of free cash flow is important, but its durability across cycles is just as critical. Consistent margins are far more valuable than volatile swings driven by commodity prices.
Transocean’s ratio of quarterly free cash flow volatility to WTI crude price volatility over the past five years was 23.8 (lower is better), indicating that its cash generation is far more sensitive to commodity-price swings than most peers. This elevated volatility limits its access to capital in downturns and makes it unlikely to act as a consolidator when weaker competitors come under pressure.
You may be asking why we wait until the free cash flow line to perform this stability analysis versus commodity prices. Why not compare revenue or EBITDA to WTI Crude prices in the case of Transocean? Because what ultimately matters is not how much revenue or profit you earn when prices are high but how much cash you can generate when prices are low. Free cash flow is the superior metric because it includes everything from hedging prowess to growth and maintenance capex to management behavior during good times and bad.
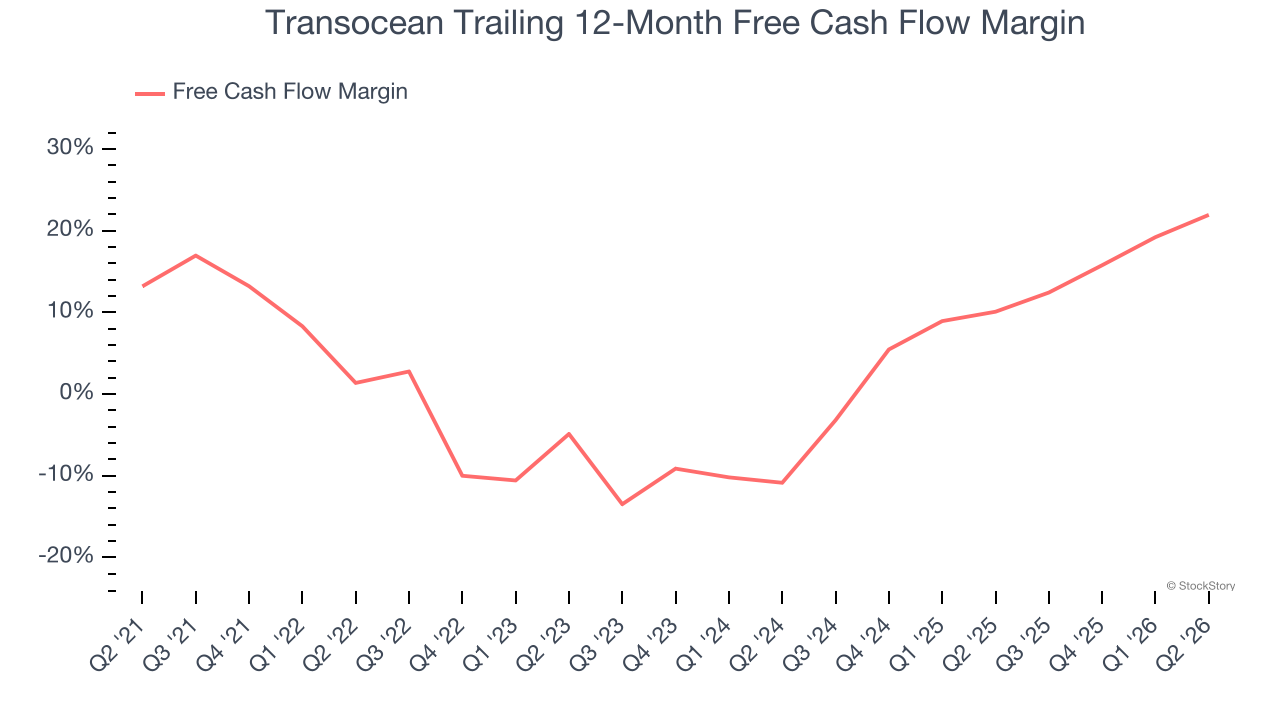
Transocean’s free cash flow clocked in at $212 million in Q2, equivalent to a 21.9% margin. This result was good as its margin was 11.4 percentage points higher than in the same quarter last year, building on its favorable historical trend.
Key Takeaways from Transocean’s Q2 Results
It was good to see Transocean beat analysts’ EPS expectations this quarter. We were also glad its EBITDA outperformed Wall Street’s estimates. Zooming out, we think this was a good print with some key areas of upside. The stock remained flat at $5.19 immediately following the results.
Sure, Transocean had a solid quarter, but if we look at the bigger picture, is this stock a buy? The latest quarter does matter, but not nearly as much as longer-term fundamentals and valuation, when deciding if the stock is a buy. We cover that in our actionable full research report which you can read here (it’s free).